
North American private equity firms are sitting on almost $980bn in reserves. It may look like they have nowhere to put it, but history shows that relative levels are healthy
North American private equity firms are sitting on almost $980bn in reserves. It may look like they have nowhere to put it, but history shows that relative levels are healthy
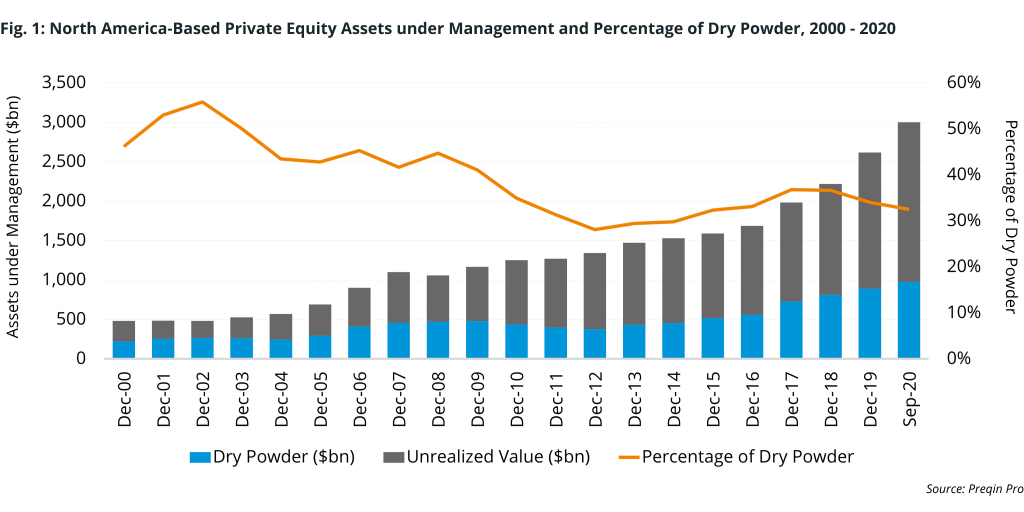
North America-based private equity firms boasted a record-high $976bn in dry powder as recently as last September (Fig. 1). That sum, coupled with $2.03tn in unrealized value, drove aggregate assets in the region to historic levels, as investors continue to flock to the asset class.
In absolute dollar terms, the amount of capital waiting to be deployed may alarm some investors, who could be wondering if the market has become saturated. Of the 186 private equity managers surveyed by Preqin in November 2020, about half told us the market was at least somewhat overvalued and could stand some reduction. Only 2%, however, believed valuations were a significant issue.
Calming anxieties, perhaps, is the amount of dry powder relative to the total assets. At $976bn, the amount of dry powder as of September 2020 made up just less than a third (32.5%) of the total $3.0tn in AUM, which is slightly below the 10-year average of 32.6%. Concerning the absolute number, the private equity industry has shown itself capable to take on more capital while still performing for its clients.
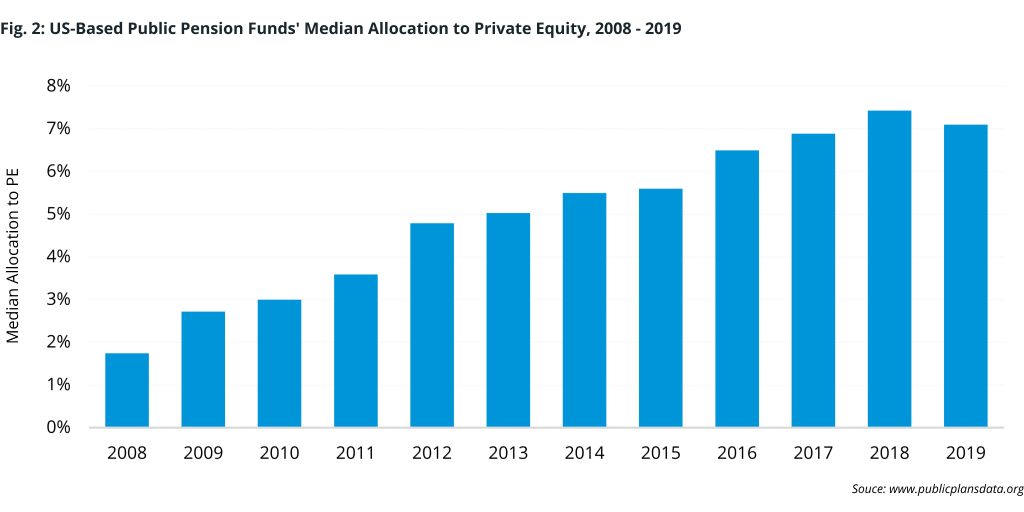
Between 2008 and 2019, industry assets more than doubled, fueled in part by growing interest from US public pension funds (Fig. 2). This cohort of nearly 200 institutional investors has collectively increased its private equity allocation in the years since the Global Financial Crisis (GFC) to a median allocation of 7.1% of net assets, up from about 1.7% in 2008.
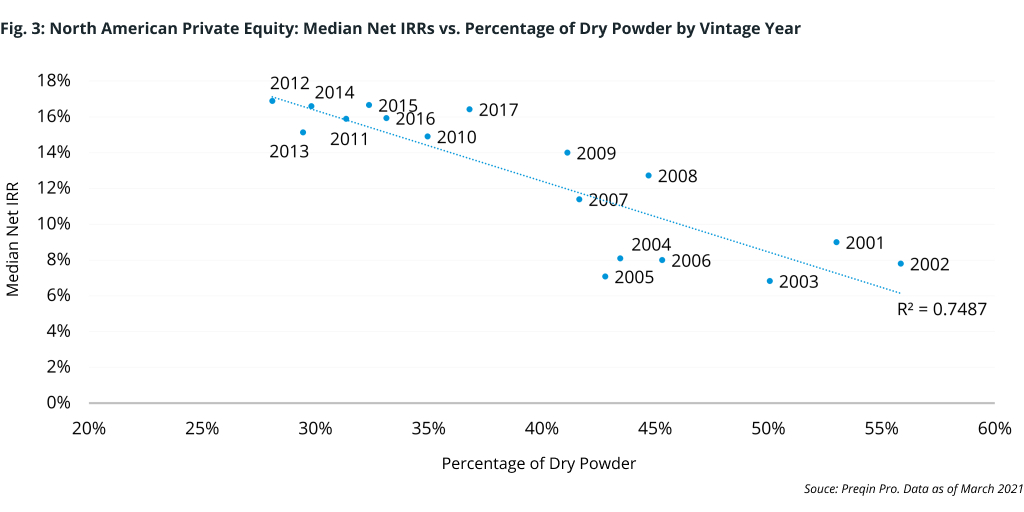
Returns have also proved resilient to rising assets. Fig. 3 shows how fund vintages from years with low relative dry powder have outperformed periods when larger amounts of cash were available. The early 2000s were the heyday for having cash on hand. This period dealt with the fallout of the dot-com crash and the recession following September 11, but was also the early innings of institutional private capital investment. The second cluster shown in Fig. 3 contains the years of the global recession (2007 through 2009), with the third encompassing the post-recession years. It’s unlikely that these clusters fell roughly into chronological order on accident; there is a clear evolutionary pattern occurring, where the industry may have found a sweet spot for cash on hand, while reducing the volatility of returns seen in vintages past.
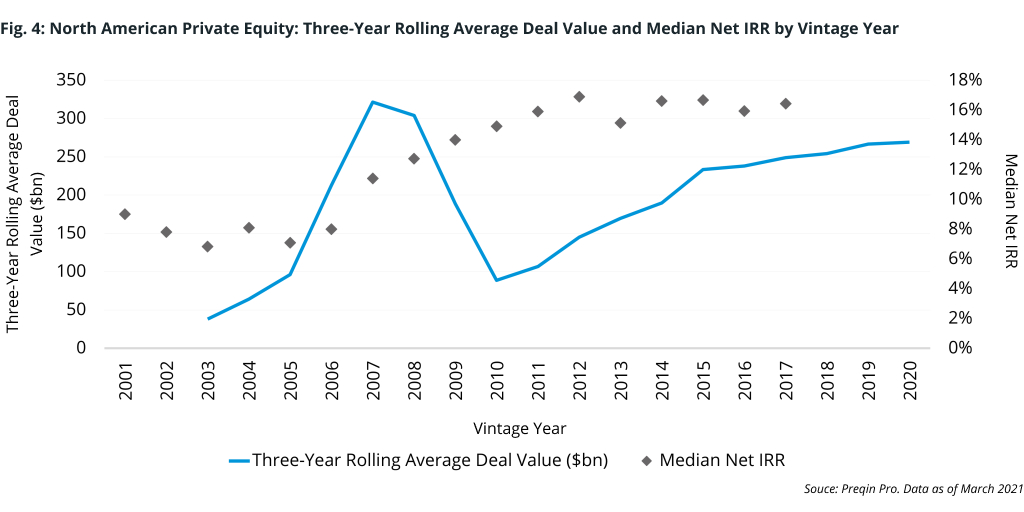
Even if North American managers have found their ideal ratio of dry power to assets, the absolute of available capital could still have had some effect on deal valuations. The three-year average deal value has crept up as more participants have entered the market. This uptick in competition could already be influencing performance; Fig. 4 shows that overall growth in median IRRs has begun to flatten (Fig. 4).
Private equity capital appears to be growing proportionately, but it’s still hard to ignore the absolute figure of cash on hand as it approaches $1tn. This will be the real test for the industry as it continues trying to deliver on client expectations. Cash flow, or distributions vs. capital called, turned negative in 2019 and into H1 2020, suggesting that managers are finding opportunities to put that cash to work.