
Private equity buyout allocations have concentrated, with allocations underrating speedy returns
Private equity buyout allocations have concentrated, with allocations underrating speedy returns
Private equity buyout deals in the technology sector have become more prominent than they were ten years ago, no longer showing the same sector diversity as in 2012. As the deal market has grown more tech-focused, the rate at which capital is returning to investors is slow and steady.
A shift in allocations
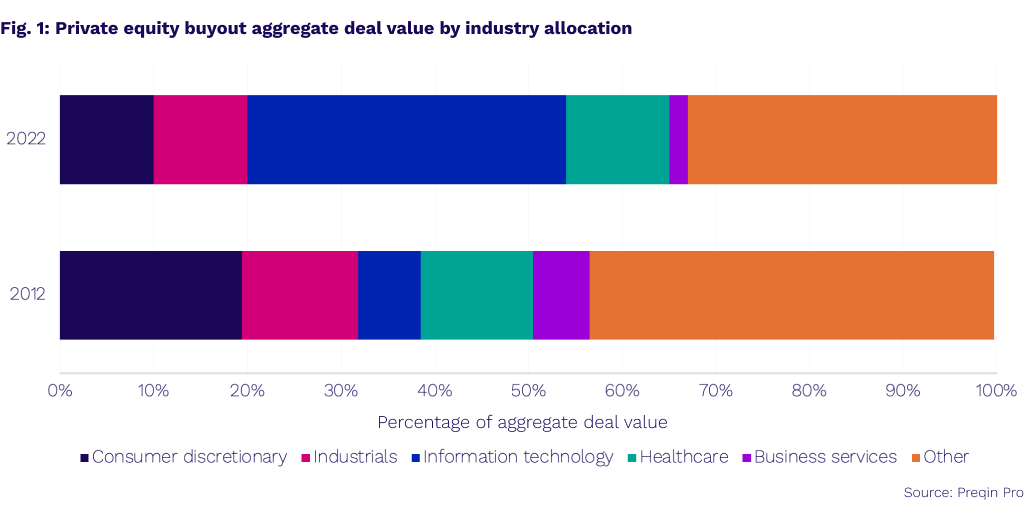
Portfolios were more dispersed in 2012. The aggregate deal value of private equity buyouts was more evenly distributed in 2012, with no single industry exceeding 20%. At the time, consumer discretionary, healthcare, and industrials accounted for the largest percentages, with 19%, 12%, and 12%, respectively*. The three industries collectively made up $137.2bn of the $397bn total aggregate deal value for private equity buyout deals that year. There was only a 13% difference between the largest portion, consumer discretionary, and the smallest, business services.
The breakdown of deal flow by sector tells a very different story in 2022. Private equity buyout deals over the last twelve months show significantly less sector diversification, with tech accounting for a third of all aggregate deal value. Though stark now, the shift toward IT has occurred somewhat gradually.
Tech buyout deals have steadily increased in deal value over the past decade. The industry occupied approximately 10% of private equity buyout deals, increasing to 20-25% since 2015, to reach a new peak in 2022. This last year, aggregate deal value leaned disproportionately toward information technology, accounting for 34% of the total $683bn seen in 2022. In deal value, tech held a 30-percentage point lead, ahead of the next-largest industry, healthcare. Much of the increase is likely due to other industries growing more technology-focused, allowing for greater development in the tech space.
Most notably, the “other” category declined to 33% in 2022, implying less distribution among fewer industries. This begs the question: are the industries seeing a rise in capital inflows, and returning capital to investors at similarly higher rates?
Does speed matter?
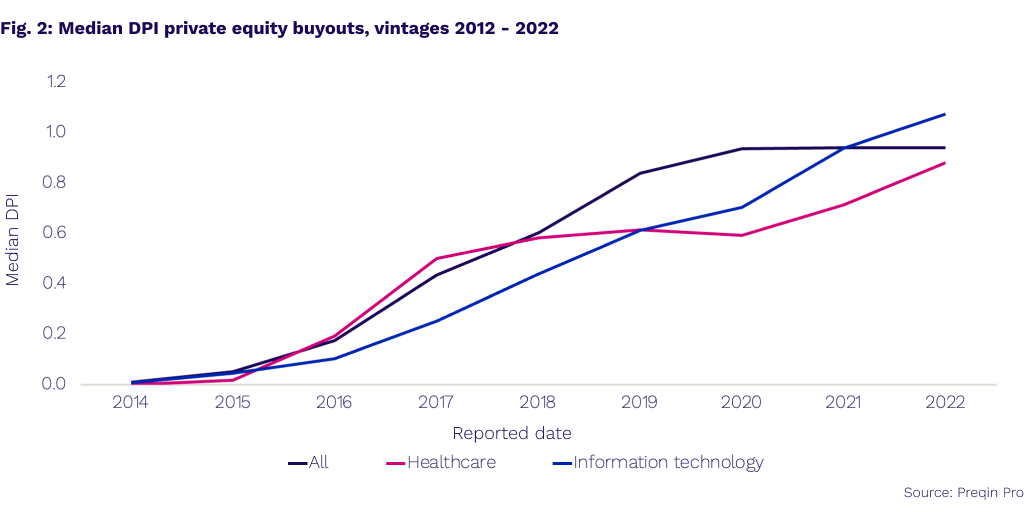
To explore this, we looked at the median Distributed to Paid-In Capital (DPI), or the ratio of investor capital returned to them relative to their initial investment, for deal vintages 2012 to 2020. The aggregated numbers helped us examine the rate at which buyout deals from over the past decade distribute capital back to LPs. Along with the DPI figure, we looked specifically at the information technology and healthcare industries, as well as the broad buyout market as a benchmark. Tech and healthcare share similar characteristics as both are research-based and concerned with the long-term outlook of their expected revenues.
As an aside, we should acknowledge that looking at a collection of buyout deals across a ten-year period will consider many deals at various stages of their lifetimes. However, the aggregation of these still allows us insight into the overall trend of each sector’s activity.
In tech deals, median DPI numbers lagged healthcare until about 2019. The largest gap was recorded in 2017 when GPs were comparatively slow to ship capital back to LPs, with a 0.33 ratio compared with healthcare’s 0.53. The healthcare industry maintained that lead by producing even faster returns to investors from 2016 to 2019. This suggests GPs need more time to extract value from their investments. But was it always worth the wait?
Despite falling behind healthcare initially, tech buyout deals generated capital more quickly over the ten-year period. The average percentage increase of the DPI ratio for tech buyout deals in the last ten years was 52%, notably higher than the 34% produced by all private equity buyout deals, and even higher than the 14% seen in healthcare. While healthcare managed to gain a higher median DPI more quickly, the industry slowed, and in fact nearly plateaued, before rising slightly in the last two years. This is likely due to increased interest rates fueled by the pandemic. IT deals on the other hand, increased from a 0.05 median DPI in 2015 to 0.93 in 2022. The tech industry shows signs of a steeper incline that has and will continue building, but such exceptional persistent growth may prove unsustainable.
As 2022 showed, tech is not necessarily the golden goose it was once thought to be. The industry is susceptible to the volatile market and its cash flows take longer to develop. Higher interest rates will have a direct impact on this, and significant changes are already playing out. Even as tech buyout deals have proved adept at quickly returning capital to investors, higher long-term rates will weigh on future cash flow valuations and leave GPs wanting to hold capital for longer, only distributing it when they feel they can get the most value from their assets. While the industry ventures into this less familiar world where tech is not king, LPs will hope that past levels of diversification will reappear.
Private equity buyout deals have become more homogenous. Where no industry exceeded 20% in deal value in 2012, 2022 saw a more heavy-handed approach toward IT. Manager allocations have concentrated in tech as aggregate deal value has grown significantly from 7% to 34% over the last decade. IT deals tend to lag other industries initially. While recent median DPIs show IT could be worth it in the end, present conditions in the tech space reiterate that continued success is not guaranteed. Ultimately, tech’s gift for consistent growth will be subject to the market fluctuations that lie ahead.
Make the most of Preqin’s benchmarks and benchmarking tools – request a demo with an expert today.